

Quick Answer
HYROX percentiles show roughly how you ranked in a specific race field.
That’s it.
They are not reliable enough to guide your training because:
- there is no complete global dataset
- race fields vary massively
- conditions change performance outcomes
If you want to improve your HYROX time:
Stop chasing percentiles.
Start analysing your performance.
Once you know what your race is actually telling you, the next step is to build your week around it using a structured HYROX training plan instead of trying to improve everything at once.
If your percentile is being dragged down by station fatigue, start with HYROX strength endurance.
If your pace falls apart after each station, fix that with the HYROX running programme.
And if you need to sense-check where you really sit, use the complete HYROX times and benchmarks guide before changing your training focus.
Where Do You Actually Stand in HYROX? (Reality Check)
You’re really asking:
“Am I good or not?”
Here’s the honest answer:
You don’t need a percentile to figure that out.
You need context.
Look at:
- your division
- your finish time
- how your race actually felt and unfolded
That combination tells you far more than a “top 20%” label ever will.
If you want a proper reference point, anchor it against real standards, not scraped charts:
Now you’re working with something real.
The Real Problem With HYROX Percentiles
You’re asking:
“Where do I rank?”
What you should be asking is:
“Where am I losing time?”
One gives you a label.
The other gives you a plan.
Only one improves your next race.
HYROX Percentiles Explained (Simple Definition)
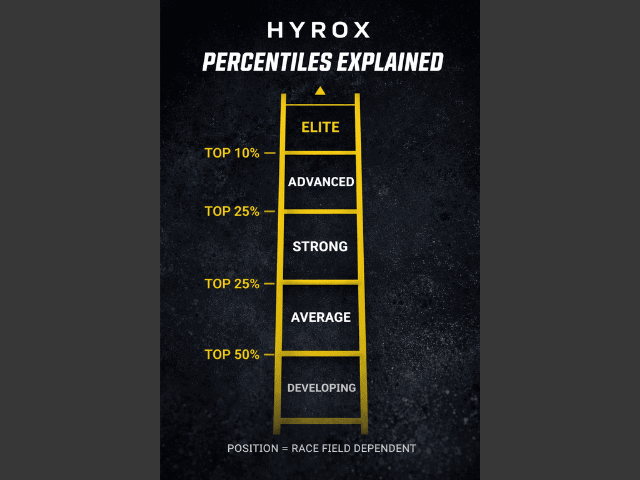
A HYROX percentile is an estimate of how your finish time compares to other athletes in your division.
The issue isn’t the definition.
It’s the data behind it:
- no official global dataset
- huge variation between races
- completely different dynamics across divisions
So while the idea is simple…
The accuracy isn’t there.
Why HYROX Percentiles Break Down So Quickly
Percentiles sound useful.
In reality, they fall apart fast.
Because they depend on:
- the specific race field
- the strength of competition that day
- course setup (sleds, layout, Roxzone length)
- division differences
That means:
Same time → different race → different percentile
So when you see:
- “Top 10% = X time”
- “Top 25% = Y time”
You’re looking at:
A rough snapshot — not a universal standard.
That’s why percentiles give you:
- false confidence
- unnecessary doubt
But rarely clarity.
What People Think Percentiles Show (vs Reality)
What you think:
- “Top 20% means I’m performing well”
- “Top 10% means I’m close to elite”
What it actually means:
You were faster than a portion of that specific race field.
It does NOT tell you:
- how well you paced
- where you lost time
- what limited your performance
- what to fix next
If you actually want that level of clarity, you need to understand how HYROX is structured as a race, not just the outcome. If you’re still unclear on that, read a complete HYROX race rules breakdown before analysing anything deeper.
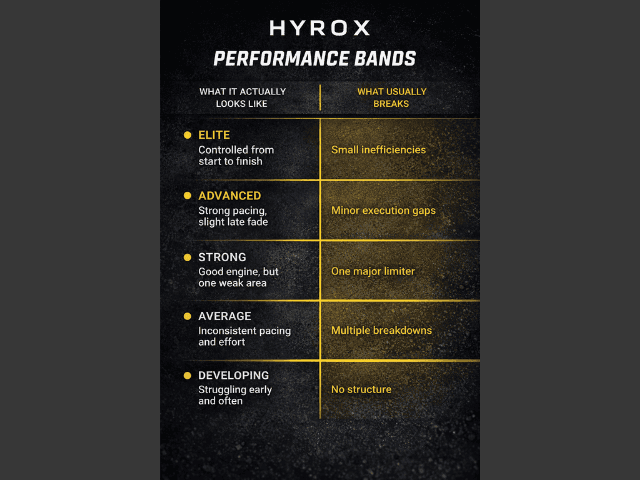
HYROX Performance Bands (What Actually Matters)
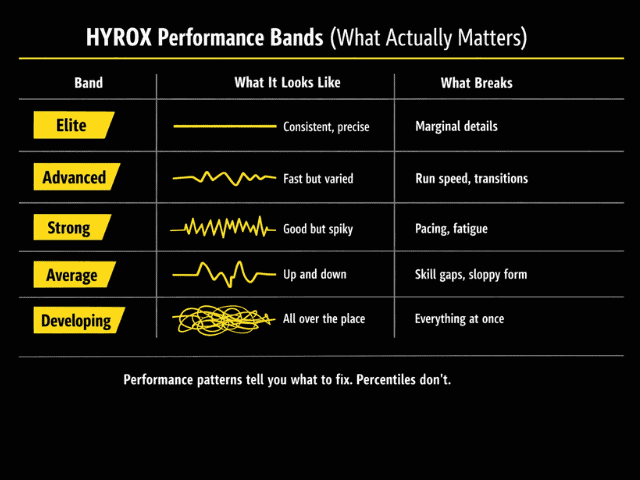
If you want something useful, use performance patterns instead.
Not labels.
Not percentages.
Patterns.
| Band | What It Actually Looks Like | What Usually Breaks |
|---|---|---|
| Elite | Controlled from start to finish | Small inefficiencies |
| Advanced | Strong pacing, slight late fade | Minor execution gaps |
| Strong | Good engine, but one weak area | One major limiter |
| Average | Inconsistent pacing and effort | Multiple breakdowns |
| Developing | Struggling early and often | No structure |
This gives you:
- context
- direction
- a clear next step
Which percentiles never do.
Same Time. Completely Different Athlete
Two athletes finish with the same time.
Athlete A:
- goes out too hard
- loses control halfway
- survives the final stations
Athlete B:
- controlled pacing
- consistent output
- finishes strong
Same time.
Same “percentile”.
Only one improves next race.
That’s the difference.
How To Actually Analyse Your HYROX Performance
Forget percentile charts.
Use this instead.
1. Anchor your finish time properly
Start with context.
Look at:
- your division
- your finish time
- how it compares to real benchmarks
Use your HYROX time benchmarks and breakdown tool to anchor this properly.
If you skip this, everything else is guesswork.
2. Break your race into parts
This is where most athletes get it wrong.
Look at:
- running consistency
- station slowdowns
- Roxzone time
If you don’t know what “good” looks like at station level, you’re missing the biggest insight. Use HYROX station split benchmarks to see where time is realistically won or lost.
Ask:
- where did rhythm break?
- where did effort spike?
- where did performance drop?
Example:
- strong runs + slow sled → strength limiter
- stable stations + fading runs → aerobic limiter
Now you’re actually analysing performance.
3. Classify your race pattern
This is your real “percentile”.
- controlled and consistent → Advanced / Elite
- strong but uneven → Strong
- inconsistent and fading → Average
That tells you what to fix.
If you don’t yet have a structure to fix it, that’s your next problem — not your percentile.
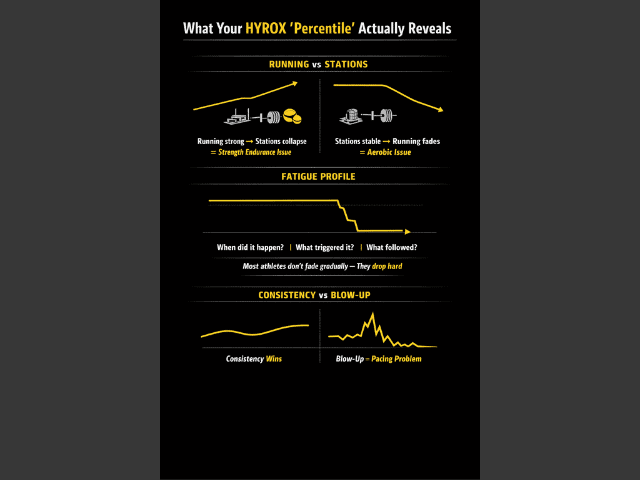
What Your “Percentile” Actually Reveals
If you insist on using percentiles, here’s the truth:
They don’t reveal performance.
They reflect outcome.
What matters is underneath.
Running vs Station Balance
Ask:
- did running fall apart?
- or did stations slow you down?
If:
- running strong, stations collapse → strength endurance issue
If that is your pattern, go to the HYROX strength endurance page next and train the station problem directly.
- stations stable, running fades → aerobic issue
If that is your pattern, go to the HYROX running programme page next and get your runs sorted.
Fatigue Profile
Most athletes don’t fade gradually.
They drop hard.
Look for:
- when performance dropped
- what triggered it
- what happened after
That’s where your biggest gains are.
Consistency vs Blow-Up Risk
Consistency wins in HYROX.
Every time.
If your race looks like:
- aggressive start
- big slowdown
- survival finish
You don’t have a percentile problem.
You have a pacing problem.
This guide on how to improve your HYROX time when your race starts strong and then falls apart shows you how to classify that pattern properly and train the limiter instead of obsessing over percentile labels.
Fix that with a properly structured approach — not random sessions. If you haven’t already, look at how to structure your HYROX training plan properly.
Biggest Mistakes When Interpreting HYROX Percentiles
These are holding you back:
- comparing across divisions → completely invalid
- ignoring Roxzone time → easiest gains available
- overvaluing running splits → stations decide your race
- assuming percentile = fitness → it’s execution, not just engine
How To Improve Your HYROX “Percentile” (Without Using Percentiles)
This is where most athletes stall.
They train harder.
They don’t train smarter.
1. Fix your biggest time leak first
Identify:
- slowest station
- biggest drop-off
- weakest transition
Fix that before anything else.
2. Build repeatable pacing
You need:
- controlled first 2–3km
- stable early effort
- consistent station output
This alone can move you up an entire performance band.
Start with this HYROX pacing strategy guide if you need a clear system for controlled starts, stable station output, and cleaner transitions.
3. Train transitions properly
Roxzone is where races are quietly lost.
Train:
- fast entry and exit
- breathing control
- immediate run recovery
Most athletes ignore this.
That’s why it’s such an easy win.
Where Are You Losing Minutes in HYROX?
You don’t need a percentile.
You need clarity.
Ask yourself:
- where is time leaking?
- what’s breaking your rhythm?
- what’s costing you consistency?
Most athletes realise the same thing:
They’ve been training the wrong limiter.
FAQs
Are HYROX percentiles accurate?
No.
They are rough estimates based on incomplete and inconsistent data.
What is a good HYROX percentile?
Wrong question.
Focus on what a good HYROX time actually looks like for your division and how your race is structured.
Can beginners reach top 25%?
Yes.
But only if they:
- follow structured training
- pace correctly
- fix key weaknesses early
Do doubles and relay percentiles differ?
Completely.
They are different race formats and should never be compared directly.
Next Step
You’ve got two options.
Keep chasing percentiles that don’t reflect reality.
Or:
- understand your finish time properly
- break down your race
- identify your biggest limiter
- follow a structured HYROX training approach
Start with:
- your HYROX time benchmarks and full breakdown
- your race structure
- and what’s actually slowing you down
Then build from there.
That’s how you stop guessing.
And start getting faster.